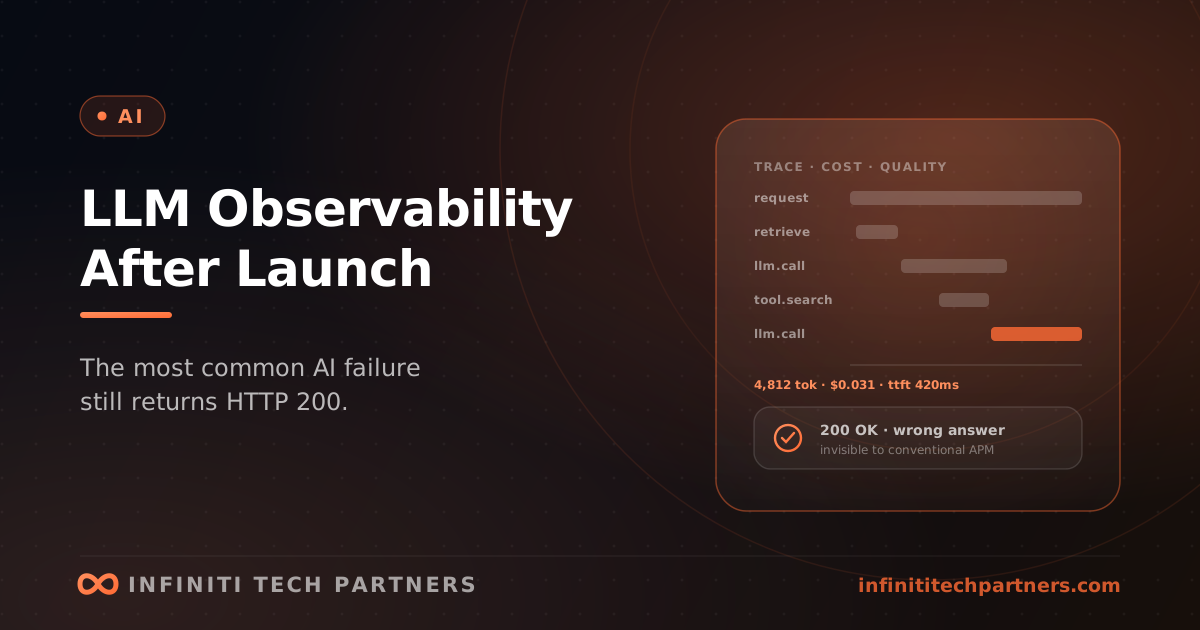
An AI feature passes its evaluation suite, ships, and for a few weeks looks fine on the dashboards that matter for the rest of the system: latency, error rate, uptime. Then a support ticket arrives with a screenshot of a confidently wrong answer, and the team discovers it cannot answer basic questions — what prompt produced that response, which documents were retrieved, which model version served it, and whether this is one case or ten percent of traffic. Conventional observability tells you the request succeeded. For an LLM feature, a successful request with a wrong answer is the most common failure there is, and it is invisible to every tool built for conventional services.
Why LLM features need different telemetry
Outputs are non-deterministic, so the same input can succeed on Tuesday and fail on Wednesday. Quality failures return HTTP 200. Behaviour changes without any deploy of yours: a provider updates a model, the retrieval index is rebuilt, someone on the product team edits a prompt, or users discover the feature and start asking it things nobody tested. Cost per request can vary by two orders of magnitude depending on context length and the number of agent steps, which makes cost control an observability problem rather than a finance one. And in agentic features, a single user action becomes a tree of model calls, retrievals, and tool invocations, where the failure is usually three levels down.
What to capture on every call
- The full prompt as sent, after templating, and the full response — or a redacted form where your data policy requires it.
- The model identifier and version, generation parameters, and the version of the prompt template that produced the request.
- Token counts in and out, computed cost, and latency split into time-to-first-token and total duration.
- Retrieved context: document identifiers, relevance scores, and the chunk text or a reference to it.
- Tool calls with their arguments, results, and errors, since tool calling is where invented arguments and loops show up.
- A trace identifier linking every step of an agent run back to the originating request, tenant, user, and feature.
- Outcome signals: schema validation failures, retries, fallbacks to another provider, explicit user feedback, and whether the user accepted, edited, or regenerated the output.
Measuring quality once it is live
Nobody can hand-label all production traffic, so quality measurement works in layers. The first is implicit user signals at full volume: regenerations, the edit distance between what the model suggested and what the user saved, copies, abandonment, and thumbs up or down. They are noisy but cheap, and trends in them are meaningful. The second is automated checks on sampled traffic — schema validity, whether the answer is grounded in the retrieved text, refusal rates, response length drift, leakage of personal data, and an LLM-as-judge score against a rubric that has been calibrated on human labels rather than trusted blindly. The third is human review of a small, deliberately stratified sample each week, over-weighted toward low scores and negative feedback. The failures found there become new cases in the offline evaluation set, and that loop — production failures turning into regression tests — is the entire point of the exercise.
What to alert on
- Cost per tenant and per feature exceeding budget. Runaway agent loops almost always show up here before anywhere else.
- Latency at p95 and time-to-first-token, which is what users actually perceive in a streamed interface.
- Provider error and rate-limit rates, so failover is a decision rather than a surprise.
- Schema validation failure rate on structured outputs.
- Spikes in refusals or 'I don't know' responses, which frequently indicate a retrieval or prompt regression rather than a model change.
- Retrieval returning no results or only low-score results.
- A sustained drop in acceptance rate or positive feedback over a rolling window, and shifts in the distribution of agent step counts.
Privacy, retention, and who can read the traces
Prompt and response logs contain customer data, and in many products they contain the most sensitive data in the entire system, because users paste things into an AI feature that they would never type into a form. Treat the trace store as production data. Scope access by tenant, redact at capture rather than at display, set retention deliberately — full content for a short window and aggregated metrics for longer — and be explicit about whether a third-party observability vendor sees the content, because if it does, it belongs on your sub-processor list and in your answers about data privacy in AI features. An engineer reading raw prompts to debug an issue is a form of production access and should be governed like one.
Build or buy
There is now a healthy market of LLM observability platforms, both hosted and open source, and several can be self-hosted. For the tracing interface, storage, and search, buying or self-hosting is almost always the right call. Using OpenTelemetry's generative AI conventions keeps those traces alongside the rest of your telemetry rather than in a separate silo. What no platform can provide is the definition of correct for your product, so the parts you will build yourself are the feature-specific outcome signals, the sampling and review workflow, and the path from a flagged production trace into the evaluation set. Self-hosting becomes a requirement rather than a preference when the data is not allowed to leave your environment.
How Infiniti Tech Partners approaches this
We instrument AI features from the first build rather than after the first incident, because retrofitting tracing after something has gone wrong means that particular failure is undebuggable. Building Tribe, our private self-hosted AI assistant, made the privacy side of this concrete: when the whole premise of a product is that data never leaves the client's own infrastructure, the traces cannot leave it either, and the observability design has to start from that constraint. For clients, the work is usually adding tracing, cost attribution, and quality signals to a feature that has already launched, and wiring production failures back into their evaluation suite. We keep a deliberately small number of concurrent engagements and plan the calendar about a quarter out. If you have an AI feature in production and cannot say how often it is wrong, that is the first thing worth finding out.
Frequently asked questions
What is LLM observability?
LLM observability is the telemetry needed to understand what an AI feature is doing in production, beyond whether requests succeeded. Quality failures in LLM features return HTTP 200, outputs are non-deterministic, behaviour changes without deploys when models, prompts, or retrieval indexes change, and cost per request varies widely. Conventional monitoring shows the request worked; LLM observability shows which prompt, model, retrieved context, and tool calls produced an answer, what it cost, and whether it was any good.
What should you log for every LLM call in production?
Capture the full prompt as sent and the response (redacted where policy requires), the model identifier and version, generation parameters, and prompt template version. Record token counts, cost, time-to-first-token and total latency, retrieved document IDs and scores, and tool calls with arguments, results, and errors. Link every step of an agent run with a trace ID back to the request, tenant, user, and feature, and record outcome signals such as validation failures, retries, provider fallbacks, feedback, and whether the user accepted or edited the output.
How do you monitor AI output quality in production?
Work in layers. Track implicit user signals at full volume, such as regenerations, edits to suggestions, and feedback. Run automated checks on sampled traffic, including schema validity, groundedness in retrieved text, refusal rates, personal data leakage, and an LLM-as-judge score calibrated against human labels. Then review a small stratified human sample weekly, weighted toward low scores and negative feedback, and turn the failures found into new cases in the offline evaluation set.
Related reading
Keeping Customer Data Safe in AI Features
How to ship AI features without leaking customer data — where your data really goes with third-party models, what gets logged and trained on, minimizing and redacting PII, tenant isolation in RAG, and giving customers honest answers.
AIStructured Outputs and Tool Calling: Making an LLM Return Something You Can Use
The gap between a demo and a product is usually parsing. How to get reliable structured output from a model, and where tool calling really breaks.
AIModel Routing and Provider Failover: Not Betting the Product on One Model
Hardcoding one model is an availability, cost, and quality risk. How to build routing and failover without an abstraction that costs more than it saves.