Reporting is the feature customers ask for constantly, that sells well in demos, and that quietly does more damage to a SaaS platform's reliability than anything else in the product. The reason is that every other feature touches a handful of rows belonging to one user, while a dashboard touches every row that customer has ever created, aggregates it, and does so against the same database that is serving logins. It ships in a sprint, works beautifully for eleven months, and then your largest customer opens the dashboard with a two-year date range on a Monday morning and the whole platform slows down for everybody.
Why the dashboard is the thing that takes you down
The shape of an analytical query is fundamentally hostile to a transactional database, and the mismatch is not something you can index your way out of past a certain size. A row-store optimised for fetching individual records has to read every row in a range to compute a sum over it, which means the work scales with the customer's data volume rather than with the size of the answer. Those queries hold connections for seconds rather than milliseconds, and connections are a finite resource that the rest of your application also needs — which is how a slow report becomes a site-wide outage rather than a slow report. They generate enough I/O to evict the working set from your buffer cache, so the transactional queries that were fast are now slow for several minutes afterwards, and the incident outlives the query that caused it. And the load is deeply uneven: the same dashboard costs a millisecond for a small customer and forty seconds for your biggest one, so your worst performance lands precisely on your most valuable account. Add the fact that dashboards get refreshed, bookmarked, auto-polled every thirty seconds by an open tab someone left on a wall display, and you have a workload that is both expensive and unpredictable.
Separate the read path first
The first and cheapest intervention is to stop analytical queries from competing with transactional ones for the same resources. A read replica dedicated to reporting achieves most of the benefit for very little work: analytical load lands somewhere that cannot exhaust the primary's connection pool or evict its cache, and the cost is accepting replication lag and being explicit about it in the interface. Set a separate, more generous statement timeout there, and a separate connection pool with a hard ceiling, so that a runaway report degrades reports rather than the product. That single change converts a class of outage into a class of slowness, which is a good trade at almost any stage. What it does not do is make the queries fast — a replica runs the same expensive scan, just somewhere less dangerous — so it buys time rather than solving the problem, and teams that stop here find themselves back in the same conversation a year later with a bigger dataset.
Pre-aggregate, and be honest about freshness
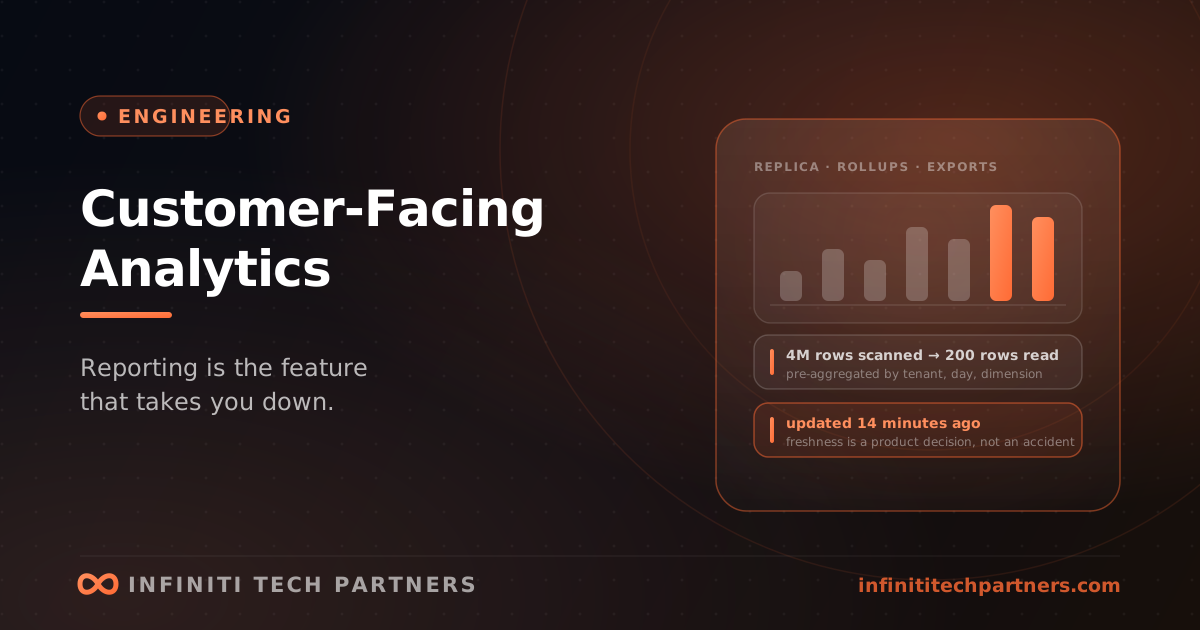
The real fix is to stop computing the same answers repeatedly from raw rows. Almost every dashboard is a small number of metrics sliced by a small number of dimensions over time, which means the answers can be computed once, incrementally, into rollup tables keyed by tenant, dimension, and time bucket. A query that scanned four million rows becomes a query that reads two hundred pre-computed daily rows, and the cost stops scaling with the customer's history. Hourly and daily grains cover the overwhelming majority of real usage; keep raw data available for drill-down, but do not let the default view depend on it. Two details make the difference between a rollup layer that works and one that becomes its own source of incidents. First, rollups must be recomputable from the raw data by a job you can re-run for an arbitrary window, because late-arriving events, backfills, and bugs are inevitable and an incrementally-maintained table that cannot be rebuilt will eventually be wrong with no way back. Second, freshness must be a product decision rather than an accident: decide whether the dashboard is real-time, near-real-time, or as-of-last-night, put that on the screen as a timestamp, and stop trying to make everything instant. Most customers are entirely satisfied with data that is an hour old and extremely dissatisfied with a number they cannot reconcile — so the visible 'updated at' label prevents more support tickets than any amount of latency work.
The multi-tenant problems nobody plans for
- Tenant skew. Your largest customer has a hundred times the data of your median customer, and a query plan tuned for the median is catastrophic for them. Test reporting against a realistic large tenant, not against seeded data.
- Permission filtering inside the query. A user who can only see their region's records must have that constraint applied in the aggregation, not after — otherwise the totals are wrong in a way that is worse than an error, because it looks like an answer.
- Exports. The CSV download is the most dangerous button in the product: it is unbounded, synchronous by default, and users click it on the largest date range available. Move exports to a background job with an emailed or in-app link, always, from the first version.
- Timezones. Aggregations bucketed in UTC and displayed in local time produce daily numbers that do not match the customer's own reporting, and this generates more disputes than any other single detail. Decide whose day boundary you use, store it per tenant, and document it.
- Auto-refreshing dashboards. A polling interval multiplied by every open tab across every customer is a load pattern you did not design. Cache aggressively per tenant and per query, and rate-limit refresh.
- Counting definitions. What counts as an active user, and does a deleted record disappear from last month's total? Write the definitions down and expose them, because a metric that silently changes meaning destroys trust in the whole feature.
Build, embed, or warehouse
There are three honest options and the right one depends on how differentiating the analytics actually are. Building it into your product gives you complete control over the interface, the performance envelope, and how the data is modelled — and it costs real engineering time both to build and to maintain forever, which is why it is worth reserving for the metrics that are genuinely part of your value proposition. Embedding a product such as Metabase, Looker, or one of the newer embedded-analytics vendors buys you a mature exploratory interface in weeks instead of quarters, and is usually the right call when customers want to slice their own data in ways you cannot anticipate — at the cost of per-tenant licensing, a visual seam in your product, and a security boundary you now depend on someone else to enforce correctly. Moving the data to a columnar store — ClickHouse, DuckDB, BigQuery, Snowflake, or Postgres with a columnar extension — is the answer when the volume genuinely exceeds what rollups on your transactional database can absorb, and it is an order-of-magnitude improvement for exactly this workload. The sequencing advice is unglamorous but reliable: replica, then rollups, then a columnar store when you have evidence you need one. Teams that jump straight to a warehouse for a feature three customers use end up operating a pipeline, a sync, and a second copy of their data model, which is a large permanent cost incurred to solve a problem they did not yet have.
Knowing when you have outgrown the current approach
The signals are consistent enough to watch for deliberately. Rollup jobs that no longer finish inside their window, so yesterday's numbers appear at lunchtime. Query times that are acceptable at the median and unacceptable at the 95th percentile, which means your largest customers are having a materially worse experience than your dashboards suggest. A steady trickle of support tickets asking why two screens disagree, which usually indicates that the same metric is defined in two places. Feature requests you keep declining because the data model cannot answer them. And a reporting replica that has grown to the size of a primary purely to serve dashboards. Any two of those together is a reasonable trigger to look at a columnar store — and it is worth pairing that decision with a cost check, because analytics infrastructure is one of the line items that grows quietly with data volume rather than with revenue.
How Infiniti Tech Partners approaches this
Analytics engagements usually begin either with an incident — a dashboard took the platform down and nobody wants that to recur — or with a sales requirement, where a customer wants reporting the current architecture cannot deliver. The first week is mostly measurement: which queries actually run, how they distribute across tenants, and what the largest customer's experience looks like as opposed to the average. That data usually reorders the plan, because the expensive queries are rarely the ones the team suspects. The work that follows is normally the sequence above, done in the order that removes risk fastest: isolate the read path so reporting can no longer take down the product, define the metrics precisely and build recomputable rollups behind them, move exports off the request path, and fix the multi-tenant details — skew, permissions, timezones — that generate disputes later. We are deliberately conservative about introducing a warehouse, and will usually push back on it until there is evidence in the numbers, because it is the decision with the largest permanent operating cost attached. If you have a reporting feature that everyone is slightly afraid of, this is a well-scoped engagement that ends with a dashboard your team is willing to leave open on a Monday morning.
Frequently asked questions
Why do in-app dashboards slow down or take down a SaaS platform?
Analytical queries are hostile to a transactional database in a way indexes cannot fix past a certain size: computing a sum over a range means reading every row in it, so work scales with the customer's data volume rather than the size of the answer. Those queries hold connections for seconds instead of milliseconds, exhausting a pool the rest of the application needs, and they generate enough I/O to evict the buffer cache so transactional queries stay slow for minutes afterwards. The load is also uneven — the same dashboard costs a millisecond for a small customer and forty seconds for your largest one.
How do you make customer-facing reporting fast?
First move analytical queries to a dedicated read replica with its own connection pool and statement timeout, which converts a class of outage into a class of slowness. Then stop recomputing the same answers from raw rows: pre-aggregate into rollup tables keyed by tenant, dimension, and time bucket, so a query that scanned four million rows reads two hundred pre-computed ones. Rollups must be recomputable from raw data by a re-runnable job, because late-arriving events and bugs are inevitable, and freshness should be a stated product decision shown as an 'updated at' timestamp rather than an accident.
Should we build analytics in-house, embed a tool, or use a data warehouse?
Build in-house for metrics that are genuinely part of your value proposition, accepting permanent maintenance cost. Embed a product like Metabase or Looker when customers want to slice data in ways you cannot anticipate, accepting per-tenant licensing and a visual seam. Move to a columnar store such as ClickHouse, DuckDB, BigQuery, or Snowflake when volume genuinely exceeds what rollups can absorb. The reliable sequence is replica, then rollups, then a columnar store once you have evidence you need one — jumping straight to a warehouse for a feature three customers use means operating a pipeline and a second data model to solve a problem you do not yet have.
Related reading
Rate Limiting for SaaS APIs: Protecting the Platform Without Punishing Customers
Rate limits decide who gets degraded when load spikes. Choosing algorithms, keys, and quotas that protect the platform without breaking integrations.
EngineeringCode Review That Actually Catches Things
Most review comments are about naming while the authorization bug ships. What review is for, what to automate, and how to make it fast enough to trust.
EngineeringBackground Jobs and Queues: The Half of Your System Nobody Designs
Async work quietly becomes the least reliable part of a SaaS platform. The properties that matter, the failure modes, and how to choose the technology.